Executive Summary
The binary trie is on the Ethereum protocol strawman as a future state tree replacement. No binary trie implementation has been benchmarked at scale — not group depth, not anything else. With this transition on the roadmap, assessing performance characteristics is a prerequisite for informed prototyping. The geth implementation (EIP-7864) exposes a --bintrie.groupdepth parameter that controls how binary levels are packed into on-disk nodes; this study benchmarks eight configurations to determine the optimal setting.
What we tested
Eight group-depth configurations (GD-1 through GD-8) on identical 360 GB databases with ~400 million state entries. Five benchmark types — two synthetic (raw SLOAD/SSTORE) and three ERC20 contract workloads — each run 9 times under a cold-cache protocol (verified cache drops, 120+ successful, 0 failures). All results use medians with Mann-Whitney U significance tests. Mgas/s is the primary comparison metric throughout, as it normalizes for block composition differences across configs.
What we found
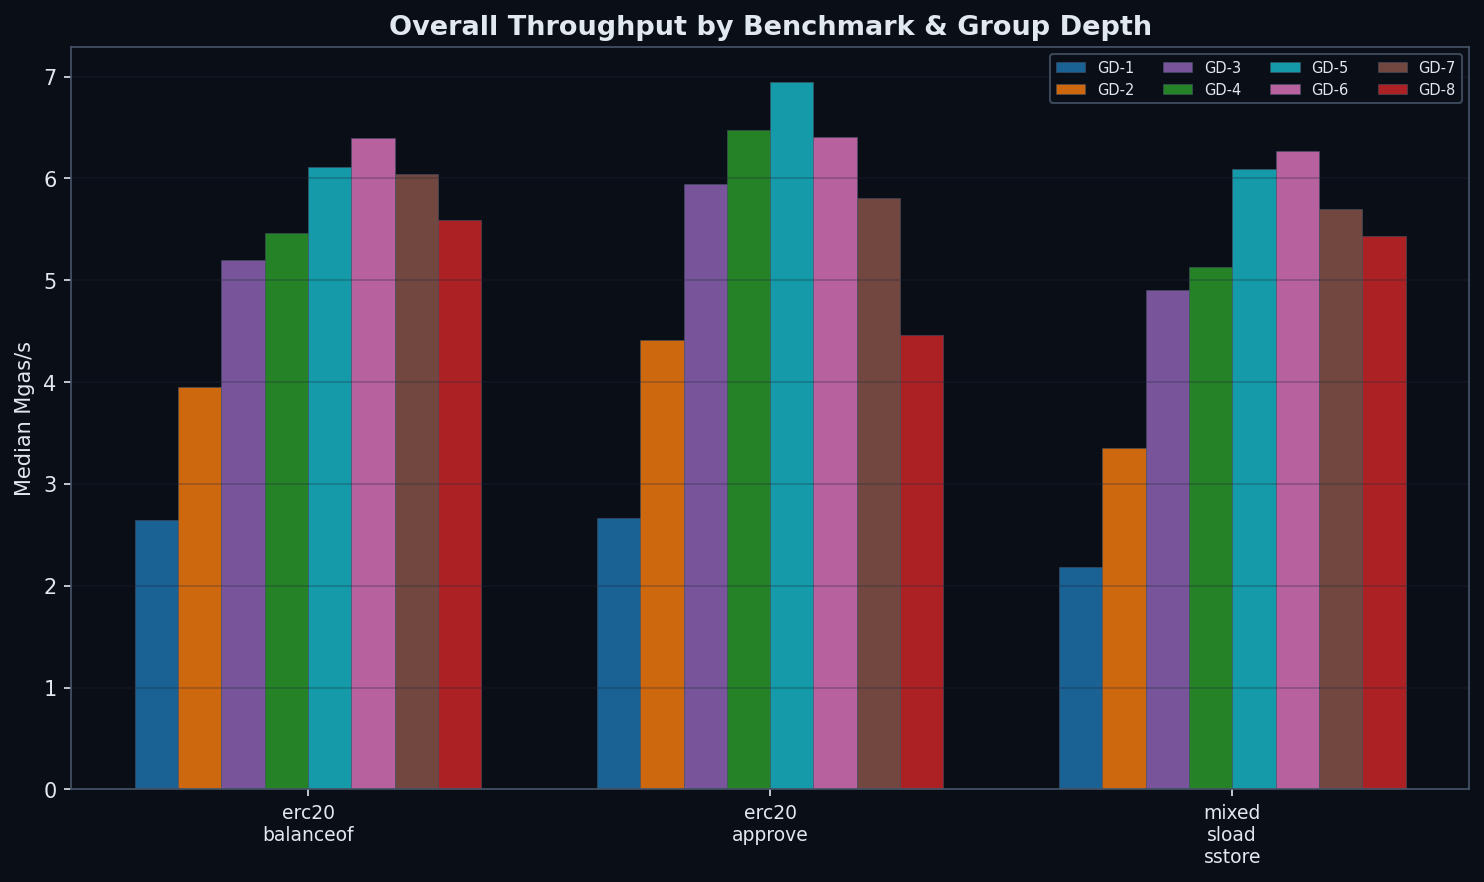
- Reads confirm the intuition (§4): Wider trees read faster. GD-8 achieves more than double the read throughput of GD-1 (5.59 vs 2.65 Mgas/s). GD-3 through GD-8 range from 5.2 to 6.4 Mgas/s by throughput, with GD-6 leading at 6.39 Mgas/s.
- Writes reveal a sharper optimum (§5): GD-5 is the write champion at 629 ms (6.94 Mgas/s) — 7% faster than GD-4 (678 ms) and 55% faster than GD-8 (982 ms) by throughput. GD-7 (5.81 Mgas/s) confirms the inflection past GD-6.
- Node size hits the Pebble block boundary at GD-7 (§5): Each GD-7 node serializes to ~4 KB (128 × 32 bytes) — exactly the Pebble block size. Below this boundary (GD-6: ~2 KB), each node fits within one block. Above it, reads may require two blocks per node. Gary Rong’s NVMe benchmarks show random 8 KB reads cost 54% more latency than 4 KB at QD=1 (77.8 vs 50.6 μs). This per-node I/O penalty compounds across ~37 path nodes, explaining why GD-7 reads slower than GD-6 despite a shorter path.
- The sweet spot is GD-5 or GD-6 (§6): GD-5 wins writes by 7% over GD-4 and GD-6 leads reads (6.39 Mgas/s) and mixed (6.27 Mgas/s). GD-7 data validates the inflection — all three benchmarks degrade past GD-6. The optimal balance lies at 5–6 bits per node.
How to read this post
§2 Background covers the binary trie and group depth concept. §3 Methodology details the benchmark setup (collapsible). §4–§6 present the results in a narrative arc: reads, writes, then the trade-off. §7 Patterns examines cross-cutting observations, and §8 Conclusions gives the recommendation and open questions. Short on time? Start with §4’s “ERC20 Reads: Where Depth Matters” — it’s the section where group depth differences become most visible and sets up the rest of the analysis.
Background
What is the Binary Trie?
EIP-7864 proposes replacing Ethereum's Merkle Patricia Trie (MPT) with a binary trie. The binary trie unifies the account trie and all storage tries into a single tree, uses SHA-256 for hashing instead of Keccak-256, and stores 32-byte stems that map to groups of 256 values. This design simplifies witness generation for stateless clients and enables more efficient proofs.
The transition from MPT to a binary trie is one of the most consequential changes to Ethereum's state layer. Performance characteristics of the new structure will directly affect block processing time, sync speed, and validator economics.
What is Group Depth?
The trie is always binary at the fundamental level — every internal node has exactly two children (left for bit 0, right for bit 1). Group depth controls how many binary levels are bundled into a single on-disk node. At GD-N, each stored node encapsulates an N-level binary subtree, so it appears to have 2N children when viewed from the outside:
- GD-1: 1 binary level per node → 2 child pointers, 256 nodes on the path to a leaf
- GD-2: 2 binary levels per node → 4 child pointers, 128 nodes on path
- GD-3: 3 binary levels per node → 8 child pointers, ~86 nodes on path
- GD-4: 4 binary levels per node → 16 child pointers, 64 nodes on path
- GD-5: 5 binary levels per node → 32 child pointers, ~52 nodes on path
- GD-6: 6 binary levels per node → 64 child pointers, ~43 nodes on path
- GD-7: 7 binary levels per node → 128 child pointers, ~37 nodes on path
- GD-8: 8 binary levels per node → 256 child pointers, 32 nodes on path
Think of it like a zip code: GD-1 reads your address one digit at a time (256 steps), while GD-8 reads 8 digits at once (32 steps). Fewer steps means fewer disk reads — but each "bundled node" is larger and more expensive to update, because the binary subtree inside it must be rehashed.
The trade-off is straightforward in theory: reads benefit from shallow trees (fewer disk I/O operations to reach a leaf), while writes suffer from wide nodes (more internal hashing when a node is modified). The question is where the crossover point lies.
Methodology
Methodology Details (click to collapse)
Benchmark Setup
| Parameter | Value |
|---|---|
| Machine | QEMU VM — 8 vCPUs, 30 GB RAM, 3.9 TB SSD, Ubuntu 24.04 LTS |
| Database | ~360 GB, ~400M accounts + slots |
| Configs | GD-1, GD-2, GD-3, GD-4, GD-5, GD-6, GD-7, GD-8 (Pebble, the LSM-tree storage engine used by geth) 4KB block size |
| Protocol | Cold cache (OS + Pebble caches dropped between runs) |
| Runs | 10 per benchmark, run 1 excluded as warm-up |
| Gas target | 100M gas per block |
Statistical Approach
- Per-run block medians aggregated across 9 retained runs
- Mann-Whitney U test for pairwise comparisons (non-parametric)
- Effect sizes reported as percentage difference from baseline (GD-1)
- Coefficient of variation (CV%) for consistency assessment
Benchmark Taxonomy
a) Synthetic benchmarks — sstore_variants (writes) and sload_benchmark (reads). These use EIP-7702 delegations with sequential storage slots. Keys are numerically sequential, causing heavy prefix sharing in the trie.
b) ERC20 benchmarks — balanceof (reads), approve (writes), and mixed. These use real ERC-20 contract code. Storage keys are keccak hashes of random addresses, producing uniformly distributed access patterns across the trie.
Block Composition Note
The execution-specs harness sends all benchmark transactions to geth’s mempool at once (within <1 second). Geth’s dev mode miner (dev.period=10) then processes transactions sequentially from this pool during a 10-second block-building window — when the timer expires, it mines whatever it managed to process. The bottleneck is trie operation time, not gas capacity: each ERC20 approve tx uses only ~4.4M gas (the 100M block gas limit could fit ~22), but trie operations (traverse, update, hash, commit) consume nearly the entire window for just 1 tx. With verified cold-cache drops in Phase 3, all configs process 1 tx per block (median tx_count=1). Setup transactions (simple ETH transfers) process 7 txs in 77ms, confirming that trie cost — not transaction overhead — is the limiting factor.
Mgas/s (throughput) is the correct comparison metric as it normalizes for any gas differences across benchmarks. Where raw ms is shown, it reflects the actual block processing time. Note that GD-7 mixed workloads use 8.84M gas/block vs 11.80M for all other configs, so Mgas/s comparisons remain valid but raw ms is not directly comparable for that benchmark.
Act I: Reads Confirm the Intuition
Wider trees should mean faster reads. And they do.
Synthetic Reads: The Baseline
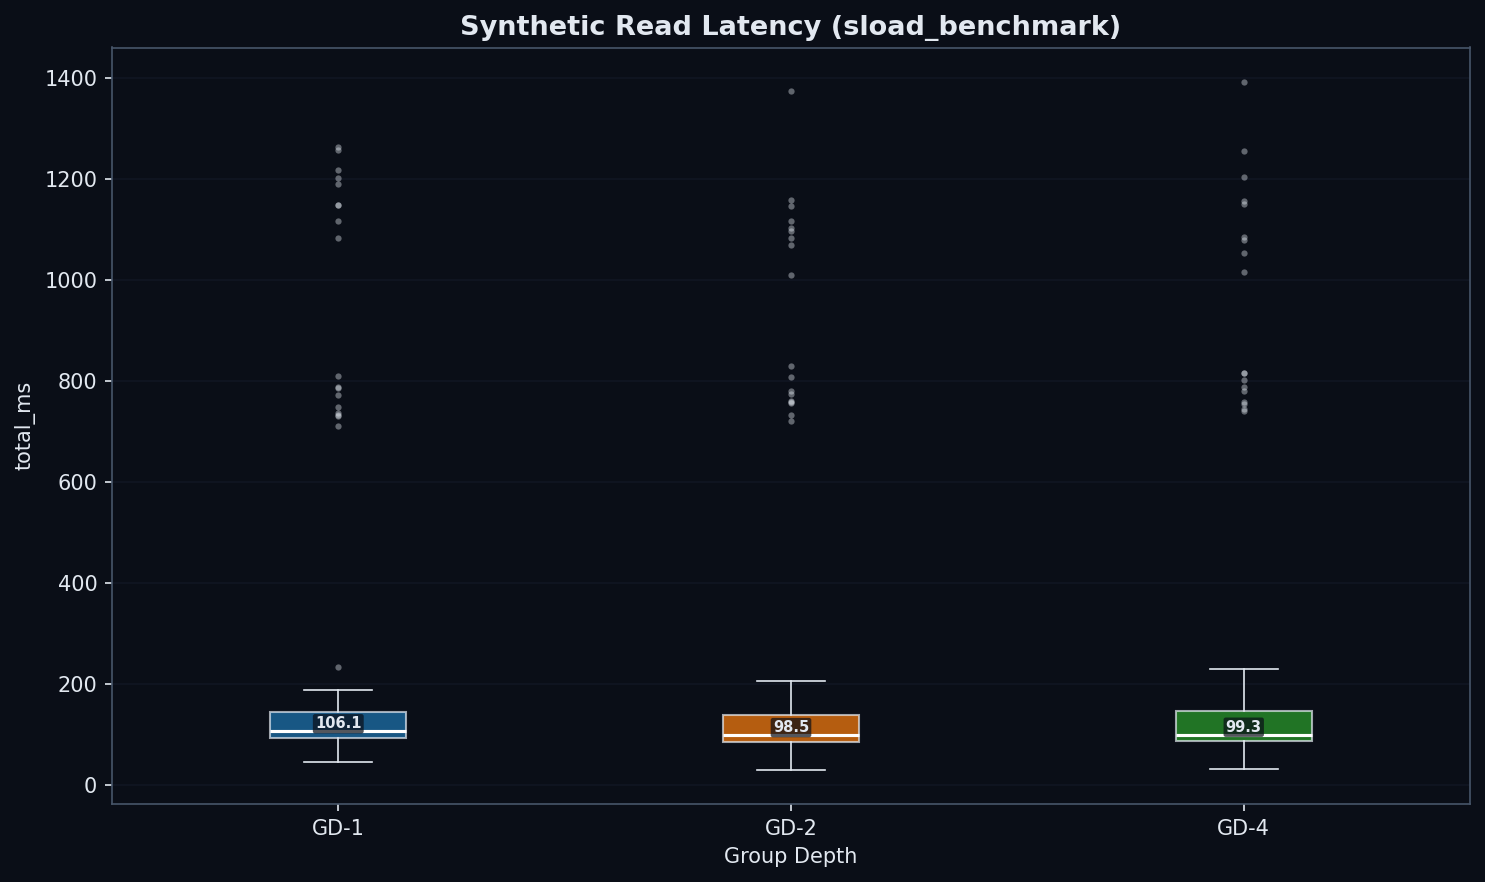
| Group Depth | Median Read (ms) | vs GD-1 |
|---|---|---|
| GD-1 | 53 | baseline |
| GD-2 | 48 | −9% |
| GD-4 | 48 | −10% |
| GD-8 | no data | |
Note: Sequential reads and writes show near-identical performance across all configs. Since group depth primarily affects random-access patterns (keccak-hashed storage slots), only ERC20 benchmarks were collected for all 8 configurations.
Only ~10% improvement from GD-1 to GD-4. Sequential access doesn't differentiate group depths because shared prefixes keep the working set small and cache-friendly regardless of tree shape.
ERC20 Reads: Where Depth Matters
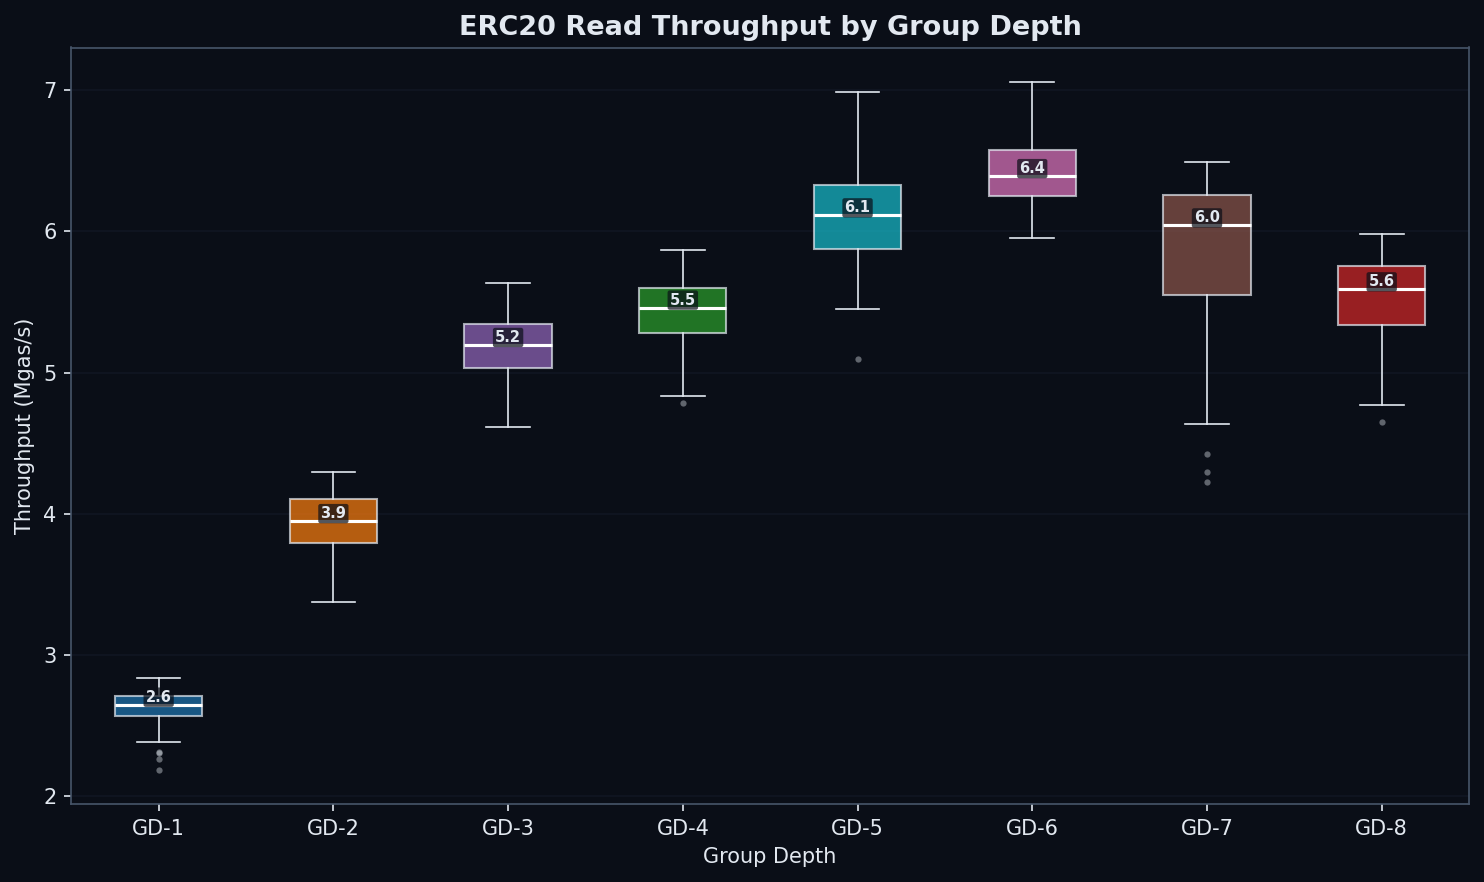
| GD | state_read (ms) | total (ms) | Mgas/s | vs GD-1 (Mgas/s) |
|---|---|---|---|---|
| 1 | 5,878 | 6,284 | 2.65 | baseline |
| 2 | 3,840 | 4,230 | 3.95 | +49% |
| 3 | 2,866 | 3,213 | 5.20 | +96% |
| 4 | 2,677 | 3,067 | 5.46 | +106% |
| 5 | 2,370 | 2,733 | 6.11 | +131% |
| 6 | 2,248 | 2,623 | 6.39 | +141% |
| 7 | 2,339 | 2,693 | 6.04 | +128% |
| 8 | 2,598 | 2,977 | 5.59 | +111% |
Why the dramatic difference from synthetic? Keccak scatters keys uniformly, forcing a full traversal from root to leaf. GD-1 must descend 256 levels; GD-8 only 32. Every level is a potential disk seek. Random access exposes the full depth penalty.
GD-3 (3,213 ms, 5.20 Mgas/s) and GD-4 (3,067 ms, 5.46 Mgas/s) show close performance despite different path lengths (~86 vs 64 nodes). GD-3’s smaller node serialization (~256 bytes vs ~512 bytes for GD-4) may interact more favorably with Pebble’s 4KB block size, partially offsetting the longer path. This near-parity supports exploring the GD × block-size matrix (Open Question #3).
Per-slot cost: synthetic reads cost ~0.02 ms/slot. ERC20 reads cost ~0.4–1.0 ms/slot — a 40× penalty from random access patterns.
This 40× ratio aligns closely with raw NVMe I/O measurements: Gary Rong’s disk page-read benchmarks show random 4KB reads at 77 MB/s vs 3,306 MB/s sequential (43×), suggesting the penalty is dominated by I/O access patterns rather than Pebble overhead.
So far, wider is better for reads. Then we tested writes.
Act II: The Write Surprise
This is the most important finding in the study.
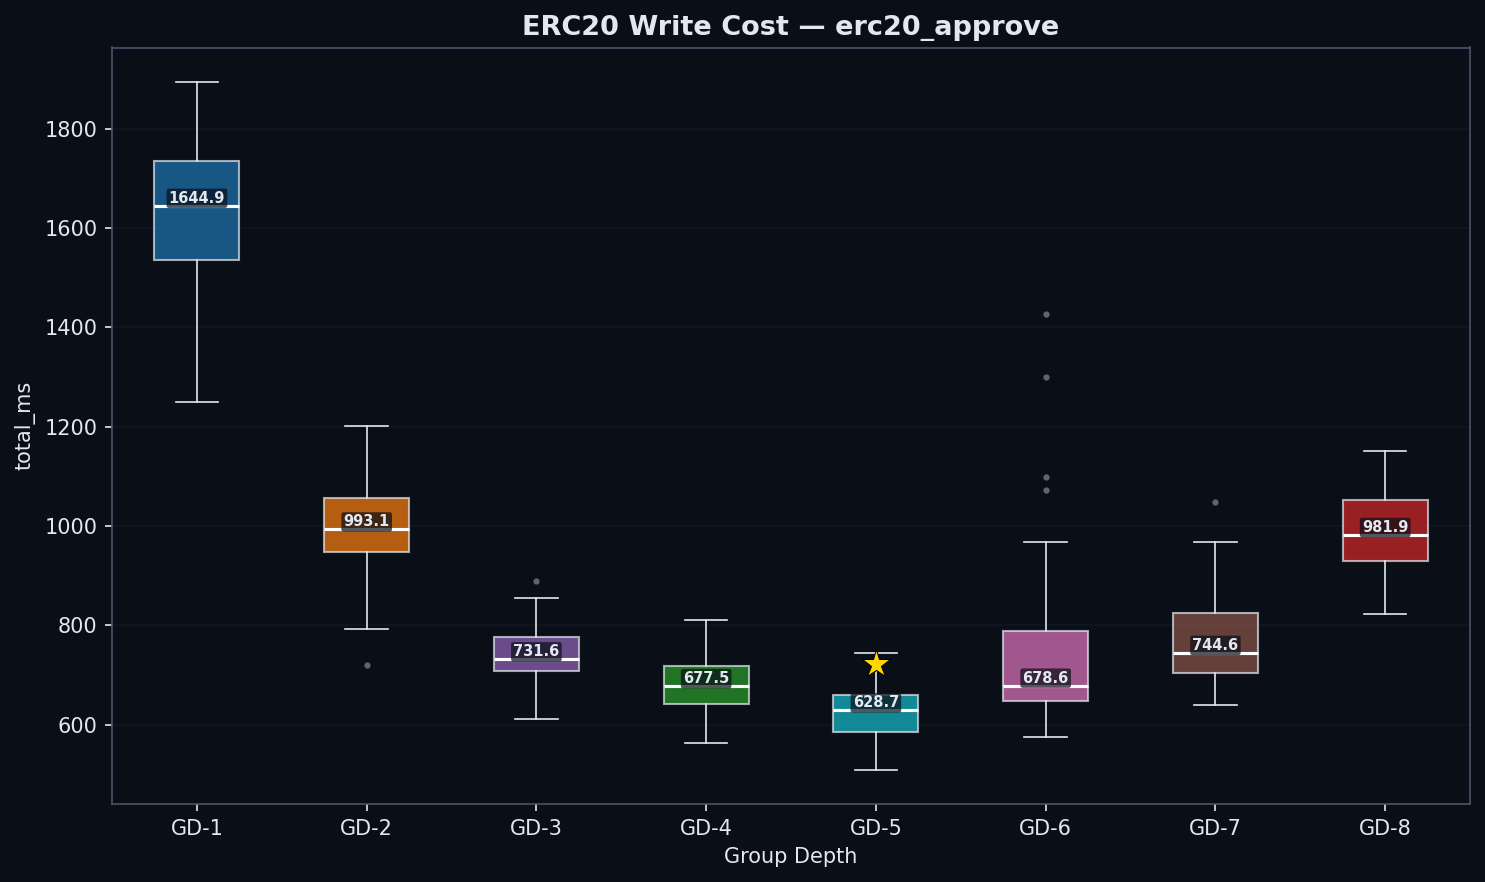
| GD | state_read | trie_updates | commit | Write Cost | Total (ms) | Mgas/s |
|---|---|---|---|---|---|---|
| 1 | 812 | 690 | 76 | 762 | 1,645 | 2.67 |
| 2 | 483 | 393 | 61 | 457 | 993 | 4.42 |
| 3 | 349 | 287 | 44 | 331 | 732 | 5.95 |
| 4 | 313 | 254 | 53 | 308 | 678 | 6.47 |
| 5 | 271 | 242 | 57 | 299 | 629 | 6.94 |
| 6 | 272 | 283 | 76 | 359 | 679 | 6.41 |
| 7 | 264 | 328 | 103 | 431 | 745 | 5.81 |
| 8 | 313 | 433 | 158 | 603 | 982 | 4.47 |
trie_updates = state_hash_ms (AccountHashes + AccountUpdates + StorageUpdates) — this metric covers the full trie mutation and rehash phase, not just hashing. Write Cost is the median of per-block (trie_updates + commit); this may differ slightly from the sum of the component medians due to properties of the median function. Phase 3 data uses verified cold-cache drops (120+ successful, 0 failures, buffers/cache 297–334M after each drop). All configs process 1 tx/block.
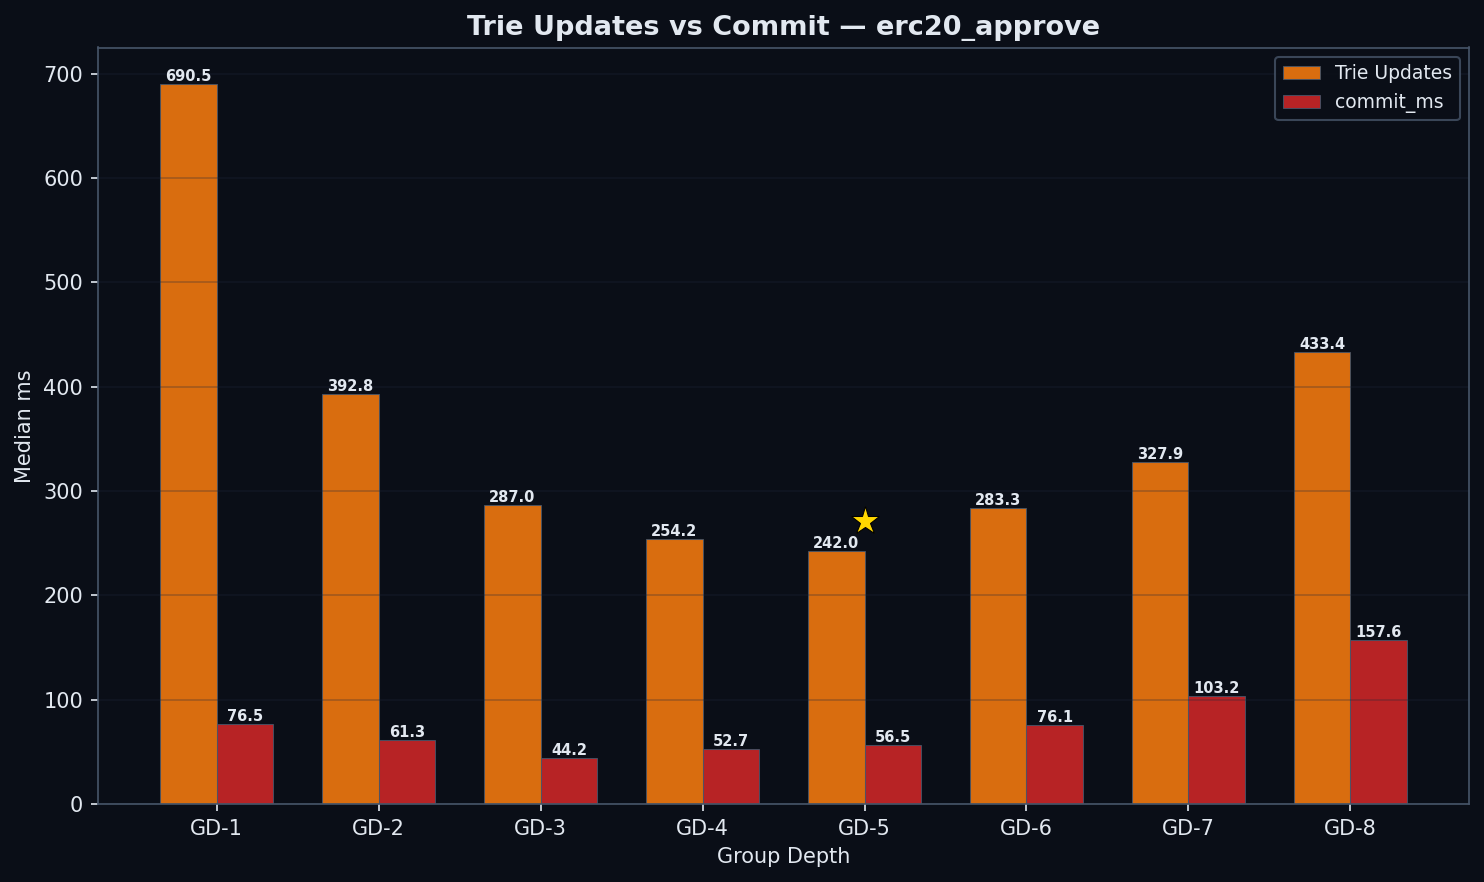
Why? The Internal Subtree
Each trie node at group depth g contains an internal binary subtree with 2g−1 nodes that must be rehashed on every write. This is the mechanism behind the surprise.
GD-8's path is 2× shorter than GD-4 (32 vs 64 levels), but each node is ~17× more expensive to rehash (255 vs 15 internal operations). GD-5 hits the sweet spot: 31 internal nodes per node × ~52 nodes on path = ~1,612 total ops, compared to GD-4's 960 and GD-8's 8,160. GD-5 finds a minimum because its path is short enough to benefit from fewer I/Os, while its per-node rehashing cost hasn't yet exploded.
Note: The 17× ratio (255 vs 15 internal hash operations) is the theoretical upper bound from the data structure definition. Our benchmarks support the mechanism: GD-8 trie update costs are 1.71× more than GD-4 (433ms vs 254ms), consistent with random writes modifying a fraction of each node's internal subtree. The geth implementation (go-ethereum/trie) is the authoritative source for the exact rehashing algorithm.
Node Serialization Size
Each trie node stores up to 2N child pointers (32 bytes each). A GD-4 node: 16 × 32 = ~512 bytes. A GD-7 node: 128 × 32 = ~4 KB — exactly the Pebble block size. A GD-8 node: 256 × 32 = ~8 KB. The size differences have cascading effects:
- Pebble block boundary: GD-6 nodes (~2 KB) fit within a single 4 KB Pebble block. GD-7 nodes (~4 KB) saturate the block — with key overhead, they likely span two blocks, potentially doubling I/O per node fetch. This partly explains GD-7’s read reversal: despite 14% fewer path nodes than GD-6 (37 vs 43), GD-7 reads ~148 KB total per lookup (37 × 4 KB) vs GD-6’s ~86 KB (43 × 2 KB).
- Pebble cache efficiency: Fewer GD-8 nodes fit in a given cache budget
- Write amplification: Larger serialized nodes increase LSM compaction overhead
- Commit cost: Commit costs scale with total bytes serialized per write path. GD-8 nodes (~8 KB each × 32 path nodes ≈ 256 KB per write) cost 158 ms vs GD-4’s 53 ms (~512 bytes × 64 nodes ≈ 32 KB). GD-6 commit (76 ms) and GD-7 commit (103 ms) show moderate increases over GD-5 (57 ms), consistent with larger serialized nodes.
Act III: The Trade-off
The Verdict
| Criterion | GD-4 | GD-5 | GD-6 | GD-7 | GD-8 | Winner |
|---|---|---|---|---|---|---|
| Reads (Mgas/s) | 5.46 | 6.11 | 6.39 | 6.04 | 5.59 | GD-6 by 5% vs GD-5 |
| Writes (Mgas/s) | 6.47 | 6.94 | 6.41 | 5.81 | 4.47 | GD-5 by 7% vs GD-4 |
| Mixed (Mgas/s) | 5.13 | 6.09 | 6.27 | 5.87 | 5.43 | GD-6 by 3% vs GD-5 |
| Wins | 0/3 | 1/3 | 2/3 | 0/3 | 0/3 | GD-6 leads reads + mixed; GD-5 leads writes |
Mixed Workloads
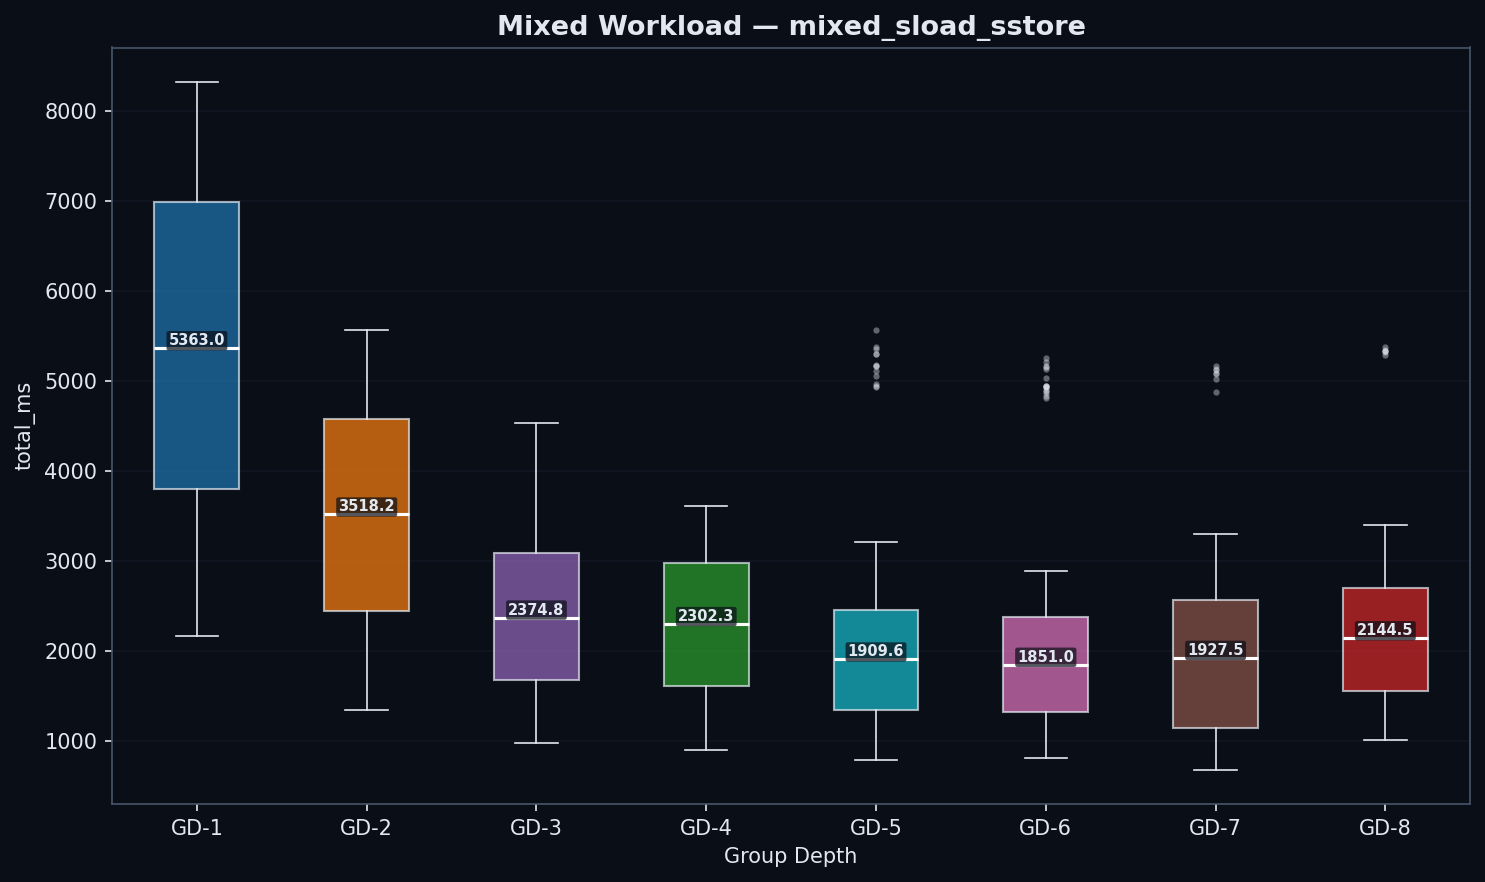
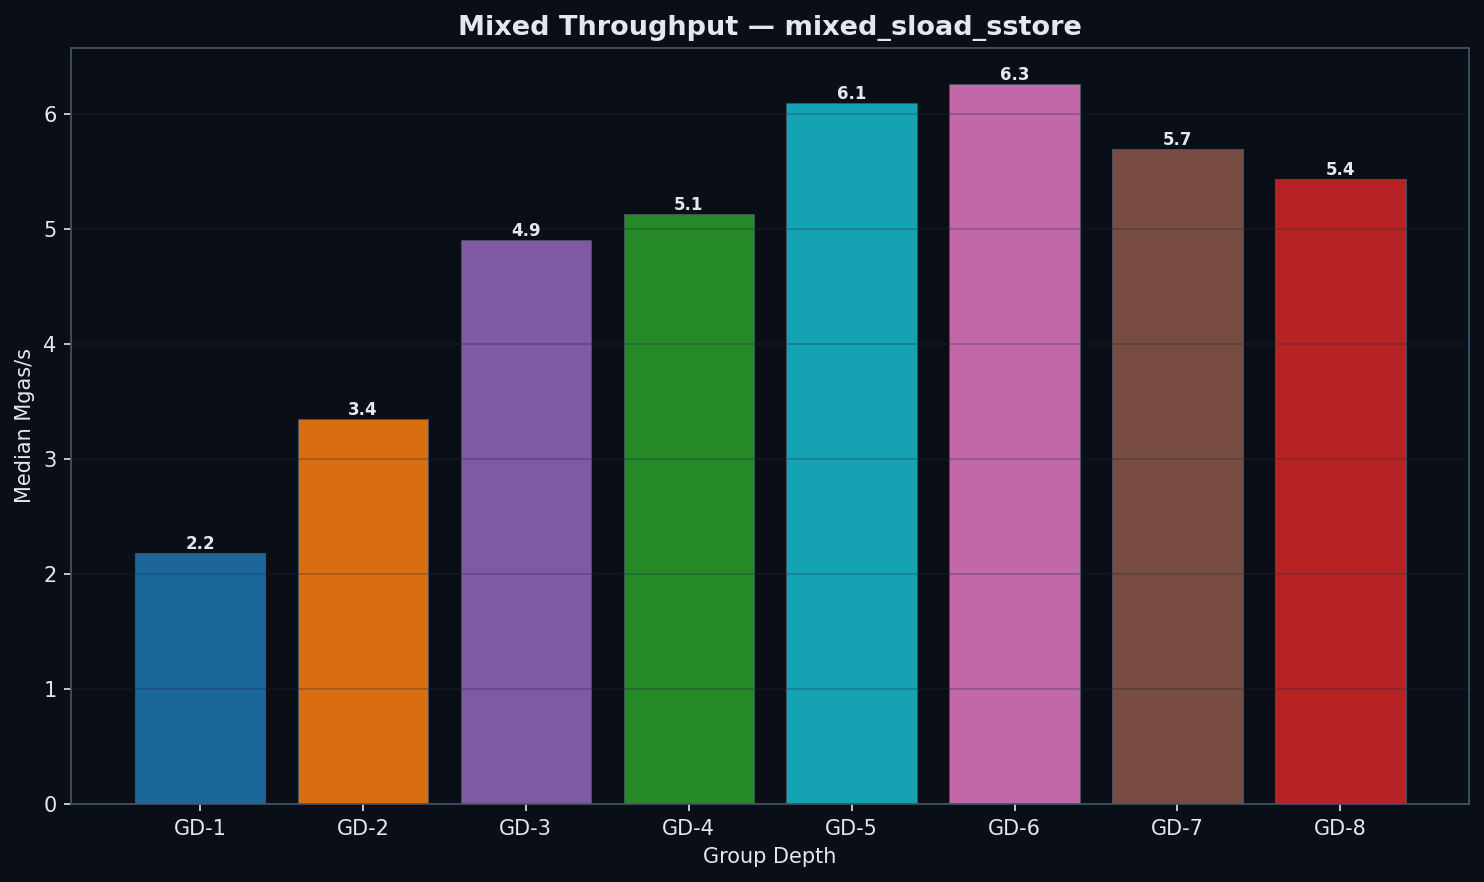
| GD | state_read (ms) | trie_updates (ms) | commit (ms) | total (ms) | Mgas/s |
|---|---|---|---|---|---|
| 1 | 4,711 | 345 | 53 | 5,363 | 2.18 |
| 2 | 3,003 | 217 | 44 | 3,518 | 3.35 |
| 3 | 1,981 | 145 | 39 | 2,375 | 4.90 |
| 4 | 1,893 | 138 | 43 | 2,302 | 5.13 |
| 5 | 1,512 | 124 | 48 | 1,910 | 6.09 |
| 6 | 1,440 | 141 | 54 | 1,851 | 6.27 |
| 7 | 1,055 | 218 | 73 | 1,529 | 5.87 |
| 8 | 1,612 | 221 | 87 | 2,145 | 5.43 |
Note: GD-7’s mixed benchmark processed fewer transactions per block (8.84M vs ~11.80M gas). Mgas/s normalizes for this difference, so throughput comparisons remain valid. Raw ms values for GD-7 mixed are not directly comparable to other configs.
GD-6 leads mixed workloads by Mgas/s: 6.27 vs 6.09 for GD-5 and 5.13 for GD-4. GD-5 is 19% faster than GD-4 (6.09 vs 5.13 Mgas/s, p < 1e-3). GD-6’s read advantage (1,440 ms state_read vs 1,512 ms for GD-5) outweighs its moderate trie update increase (141 ms vs 124 ms). GD-7 (5.87 Mgas/s) confirms the inflection: its raw state_read (1,055 ms) is lower, but GD-7 processes less gas per block (8.84M vs 11.80M), so Mgas/s is the fair comparison. Note that when showing ms breakdowns, Mgas/s is the primary metric since some configs process different gas amounts in similar wall-clock time.
Cross-Cutting Patterns
Where Does Time Go?
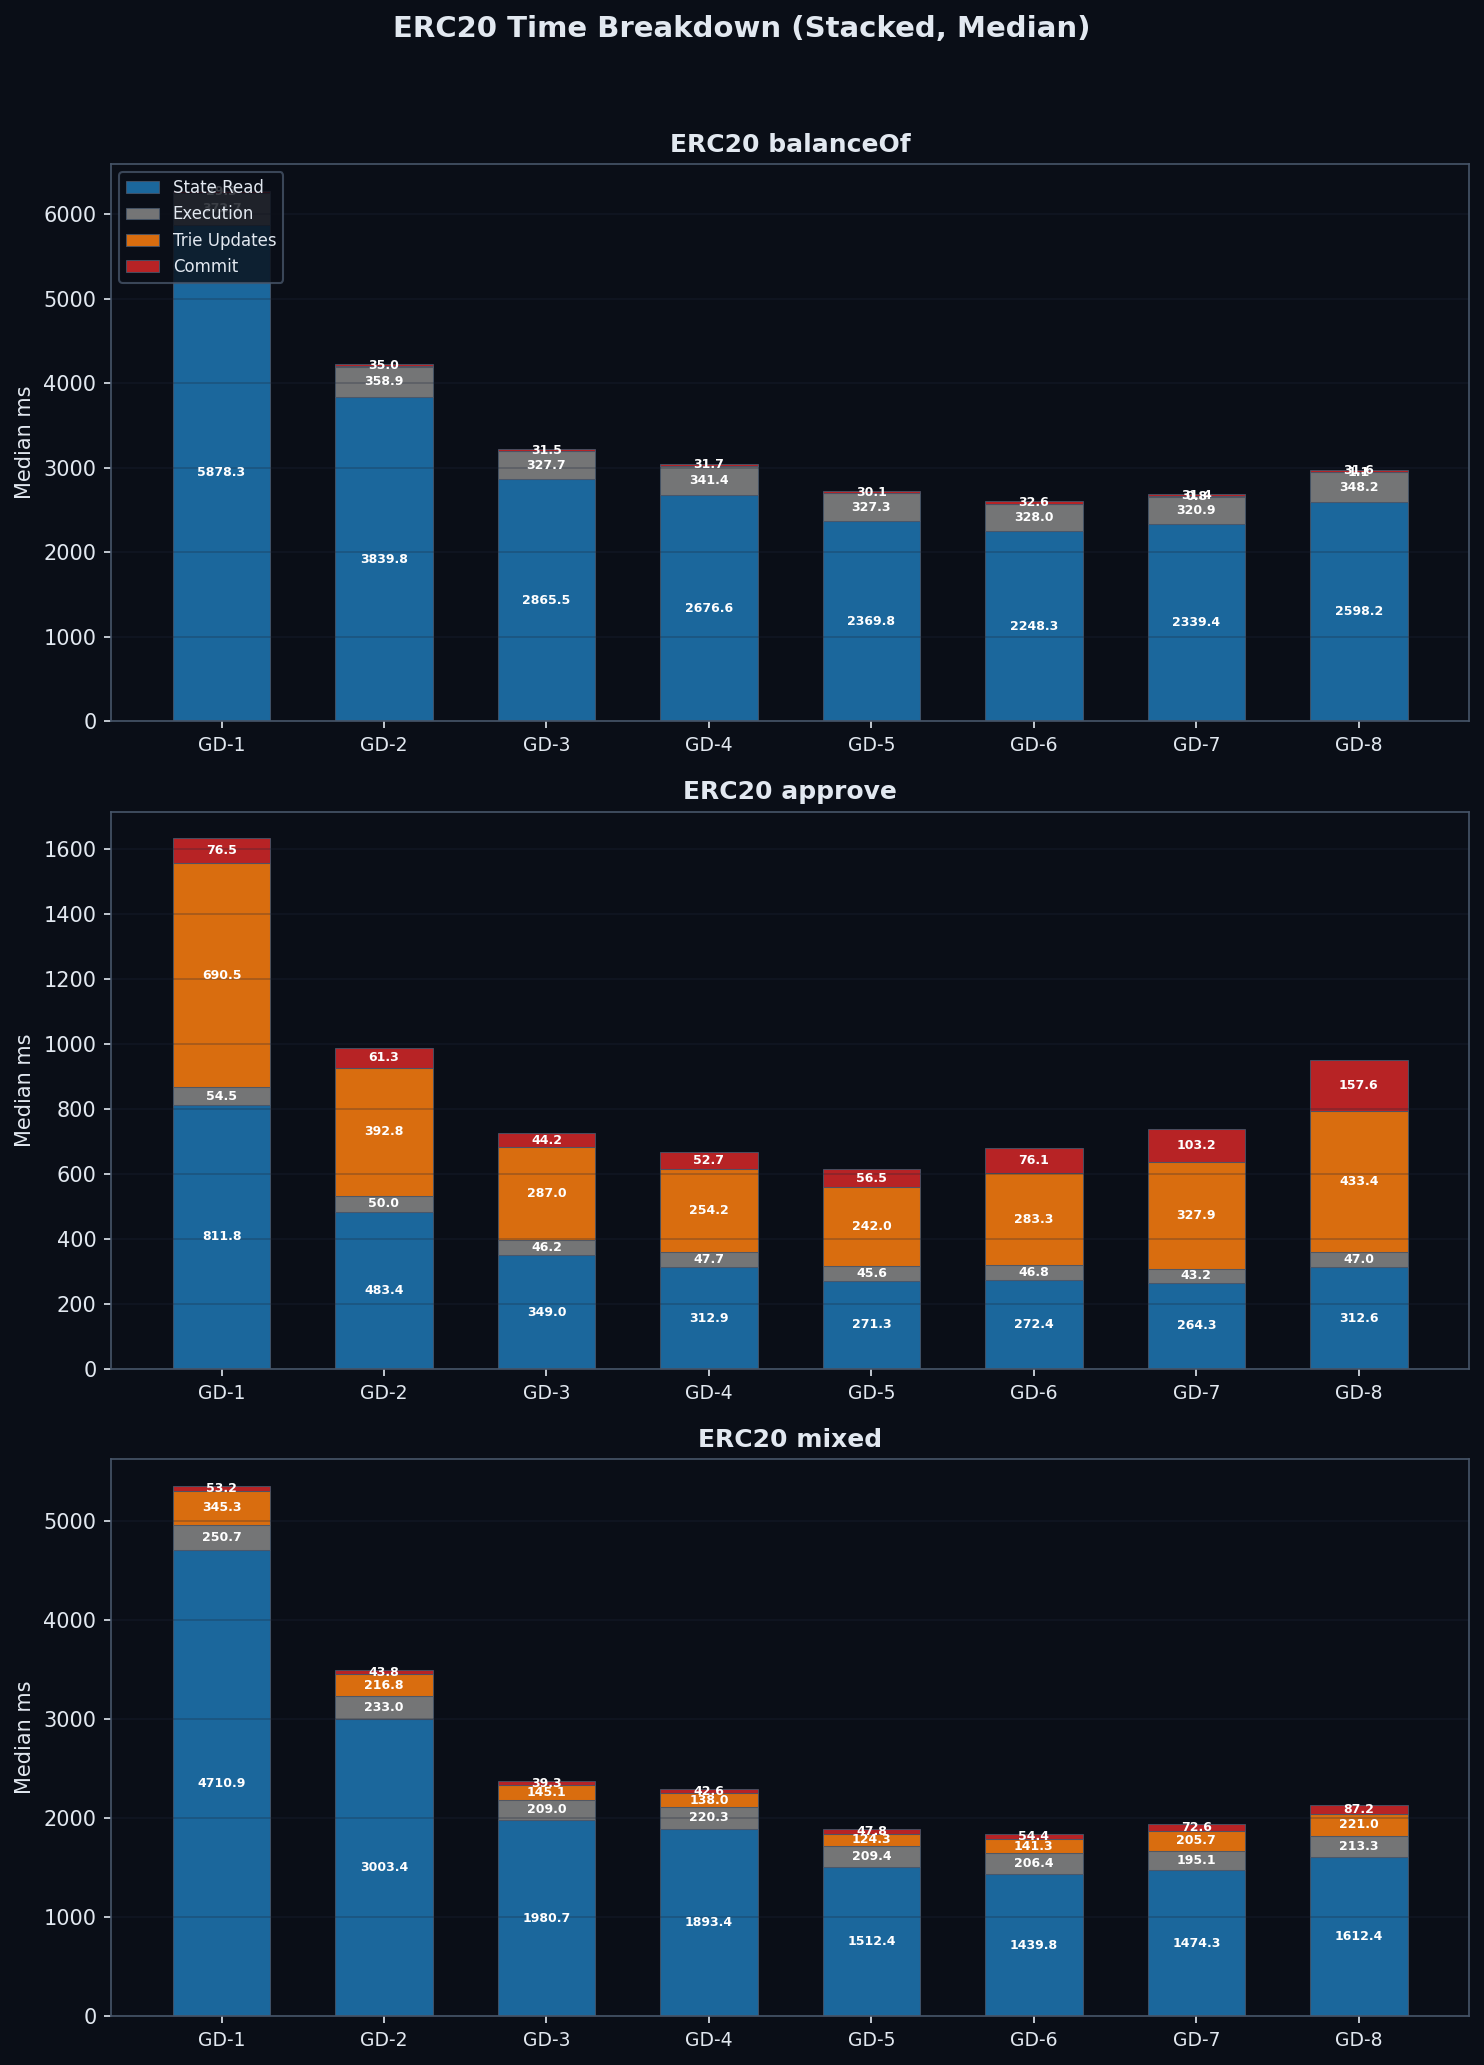
State reads dominate ERC20 block processing time across all group-depth configurations, accounting for 50–85% of total time. Trie update and commit costs are negligible for read-only benchmarks (balanceOf) but become the dominant cost component for writes (approve) — especially at higher group depths where internal subtree rehashing is most expensive.
Overall Throughput
Hardware Context: NVMe I/O Characteristics
Disk page-read benchmarks by Gary Rong on NVMe (Samsung 990 Pro) provide hardware context for interpreting our results:
- Random vs sequential: 4KB random reads = 77 MB/s (50.6 μs) vs 3,306 MB/s sequential — a 43× gap that closely matches our 40× per-slot penalty.
- Page size matters: Random 16KB reads achieve 2.3× throughput of 4KB (174 vs 77 MB/s) with only 1.8× latency. Wider group depths produce larger nodes that could benefit from larger Pebble block sizes.
- Queue depth is transformative: QD=1→QD=8 improves random 4KB throughput by 8.7× (77→673 MB/s). Parallel EVM could unlock this, compressing read latency differences between configs.
- Sublinear latency growth: 4KB→64KB = 16× data, but only 2.3× latency (50.6→117.3 μs). NVMe’s internal parallelism means larger I/O requests are disproportionately efficient.
These measurements use direct page reads bypassing filesystem caches — analogous to our cold-cache protocol. The benchmark hardware (Samsung 990 Pro) differs from our QEMU VM’s virtual disk, so absolute numbers won’t match, but the ratios reveal fundamental NVMe characteristics relevant to group depth optimization.
Conclusions
Default / read-heavy / mixed: GD-6 (wins reads by 5%, mixed by 3% over GD-5).
Write-heavy: GD-5 (wins writes by 7% over GD-4, 8% over GD-6).
GD-7 is past the inflection — worse than GD-6 on all benchmarks — confirming the sweet spot is 5–6 bits. GD-8 is suboptimal on all workloads, demonstrating diminishing returns past the sweet spot.
Root Causes
The recommendation rests on a three-step mechanism that governs every state access in the binary trie:
- Traverse — descend from root to leaf. Cost proportional to tree depth. Favors wider trees (GD-8: 32 levels vs GD-5: ~52 vs GD-4: 64 levels).
- Rehash — recompute the internal subtree of every node on the path back to root. Cost proportional to 2g−1 per node. Favors narrower trees (GD-4: 15 ops/node, GD-5: 31 ops/node, GD-8: 255 ops/node).
- Commit — serialize and write modified nodes to disk. Cost proportional to node size. Favors narrower trees.
GD-5 finds the write minimum of the traversal × rehashing trade-off. Its path is 19% shorter than GD-4 (~52 vs 64 nodes), and each node's 31 internal operations remain manageable. At GD-6, hash cost rises moderately to 283 ms (+17% over GD-5’s 242 ms) — a gentle slope, not a cliff. GD-7 data (328 ms hash) confirms the trend continues. The write inflection point lies between GD-5 and GD-6 (hash/read ratio crosses 1.0), but reads and mixed workloads still improve at GD-6, making the inflection write-specific rather than universal.
Five Patterns That Hold Across All Group Depths
1. State reads dominate. 50–85% of block processing time is spent reading state from disk, regardless of group depth or benchmark type.
2. Random access is ~40× more expensive per slot. Keccak-hashed keys (ERC20) cost 0.4–1.0 ms/slot vs 0.02 ms/slot for sequential access (synthetic).
Independent NVMe page-read benchmarks confirm that random vs sequential I/O explains nearly all of this penalty (see §7 Hardware Context for details).
3. Cache hit rates plateau at ~37–38% for random access. Despite increasing group depth, the storage cache hit rate stays within 28–38% for all keccak-hashed workloads. The 256-bit keyspace is too sparse for meaningful cache reuse beyond shared upper-level trie nodes.
4. Trie updates are negligible for reads, dominant for writes. Read benchmarks show <1% time in trie updates. Write benchmarks at GD-7/8 spend 40–60% of time rehashing internal subtrees. GD-6 is the transition point where hash cost begins to exceed read cost.
5. Run-to-run CV mostly < 10% on Mgas/s. Phase 3’s verified cold-cache drops (120+ successful, 0 failures) produce reproducible results across all 8 configs. The improvement over earlier phases validates the methodology fix.
On the Snapshot Layer
These benchmarks ran without a flat snapshot layer. Binary trie path-based reads via Pebble’s BTree index are already efficient, so snapshots may offer limited additional benefit for narrow group depths. However, wider group depths (GD-6, GD-8) could benefit more from snapshots, as their larger nodes incur higher per-read I/O cost that a flat key-value lookup would bypass (see Open Question #2).
Resolved & Open Questions
Non-power-of-2 group depths: GD-5 or GD-6 is the optimum, depending on workload. Testing all 8 configs (GD-1 through GD-8) confirmed that 5 bits wins writes (+7% over GD-4) and 6 bits wins reads (+5% over GD-5) and mixed (+3% over GD-5). GD-7 validates the inflection.
Snapshot layer validation: empirically confirm that snapshots further favor GD-5/GD-6 as our analysis predicts.
Pebble block size interaction: this study fixed block size at 4KB. NVMe page-read benchmarks show that random 16KB reads achieve 2.3× the throughput of 4KB reads (174 vs 77 MB/s) with only 1.8× the latency (89.7 vs 50.6 μs). Larger Pebble blocks could significantly benefit wider group depths whose serialized nodes exceed 4KB.
Mainnet state distribution. Largely resolved. The binary trie SHA256-hashes all keys into the 256-bit keyspace, making trie access patterns inherently random regardless of real-world state distribution. Hot contracts (DEXes, bridges) don’t cluster in the trie. The only caveat is stem-influenced access patterns, where keys sharing a stem may share upper path nodes — but this affects caching, not the group depth trade-off.
Concurrent block processing: parallel EVM execution may change the read/write ratio and shift the optimal group depth. NVMe queue depth benchmarks show that QD=8 improves random 4KB throughput 8.7× over QD=1 (673 vs 77 MB/s). If parallel execution increases effective I/O queue depth, read latency differences between group depths may compress significantly.
GD-6 data quality: Phase 3 re-run with verified cold-cache drops confirmed all measurements. All 8 configs have clean data with CVs mostly <10% on Mgas/s. GD-6 writes: 679 ms, 6.41 Mgas/s. GD-7 fills the gap and confirms the inflection past GD-6.